
The two publications that arrive on my driveway each morning (The Wall Street Journal and The New York Times, which often differ on their places on the political spectrum) are charged with trying to help their readers make sense of each day’s stock market gyrations. They do their best and have space to fill, and they understand that negative headlines attract more eyeballs, but there is seldom a simple explanation for the proverbial madness of crowds. What might sound logical initially is not always backed up by historical evidence, especially when the financial press explains with seeming certainty the rationale for a downturn in equities.
Because we believe that the secret to success in stocks is not to get scared out of them, we dedicate significant real estate in these missives to showing what has happened in the past when disconcerting headwinds were blowing. This is not meant to be a panacea and is not a guarantee that history will repeat, nor are we suggesting that folks are wrong to be concerned as the data show that 5% declines in the S&P 500 on a closing basis have occurred on 331 separate occasions over the last century and 10% Corrections have taken place 103 times, while 20% Bear Markets (of the official variety!) have happened 27 times.
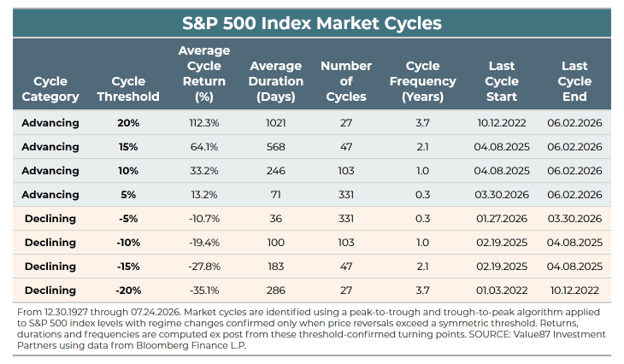
Alas, there is no magic formula that tells us when the next storm will arrive. And even if we had access to the newspaper headlines in advance there is no assurance that stocks would perform as we might expect in the short run, while the long-term numbers tell us that equities have been the place to be for those who remember that time in the market trumps market timing,…
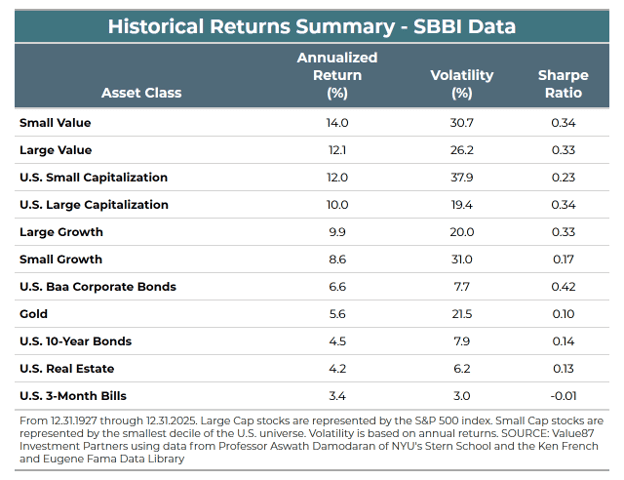
…as all prior scary events have been overcome in the fullness of time.
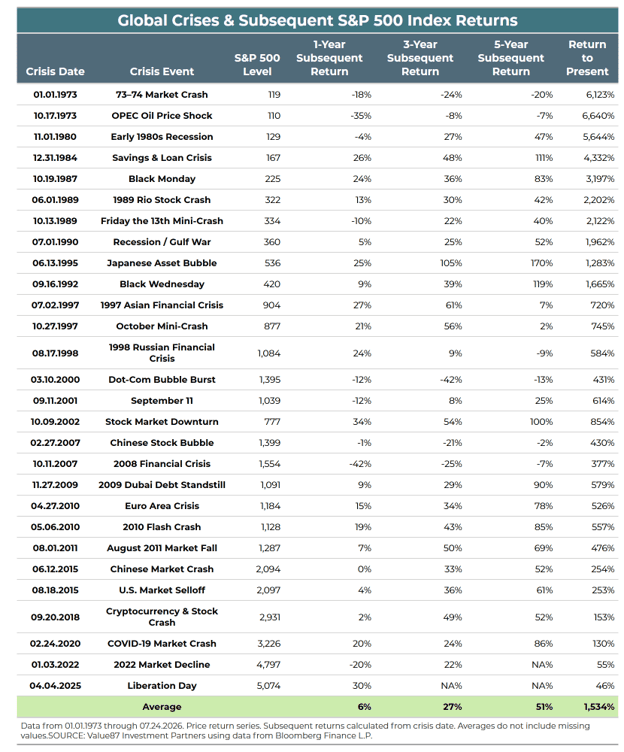
This is why we are so fond of the quotation from the American engineer and inventor Vannevar Bush, “Fear cannot be banished, but it can be calm and without panic; it can be mitigated by reason and evaluation.”
For current reason and evaluation, we examine the explanation cited by The Wall Street Journal for the skid of more than 500 points in the Dow Jones Industrial Average and the 2.2% plunge in the Nasdaq Composite index this past Thursday.
Oil prices roared back on Thursday to crack the $100 a barrel mark, an inflation-triggering threshold that threatens to bedevil the U.S. economy while putting pressure on the Republicans ahead of the midterm elections.
As President Trump warned Iran could soon feel “major military punishment,” Brent crude, the global gauge, topped $100 a barrel for the first time since May. The U.S. oil price shot up 6.2% to $92.19 a barrel.
Higher energy prices reverberated through markets, stoking a selloff in government bonds that sent the yield on the 10-year Treasury note—a key barometer for borrowing costs—to new 18-month highs.
We respect that some will accuse us of Pollyanna behavior and nobody knows how the conflict in the Middle East will play out or when hostilities may dissipate, but America has been involved militarily in that part of the world since 1990 when the Dow was in the 3000 range at the start of the first Gulf War.
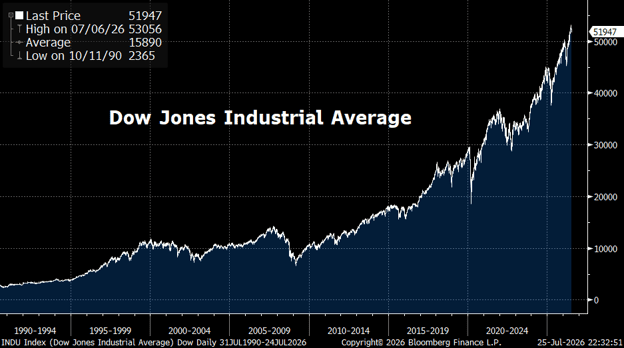
Yes, this time is different, but so is every time, and I note that the Dow was in the 10000 range nearly 25 years ago when the first plane that slammed into the World Trade Center went over my head just as I was about to turn onto Fifth Avenue from 17th Street in Manhattan. It is hard to argue that today is more worrisome than 9/11.
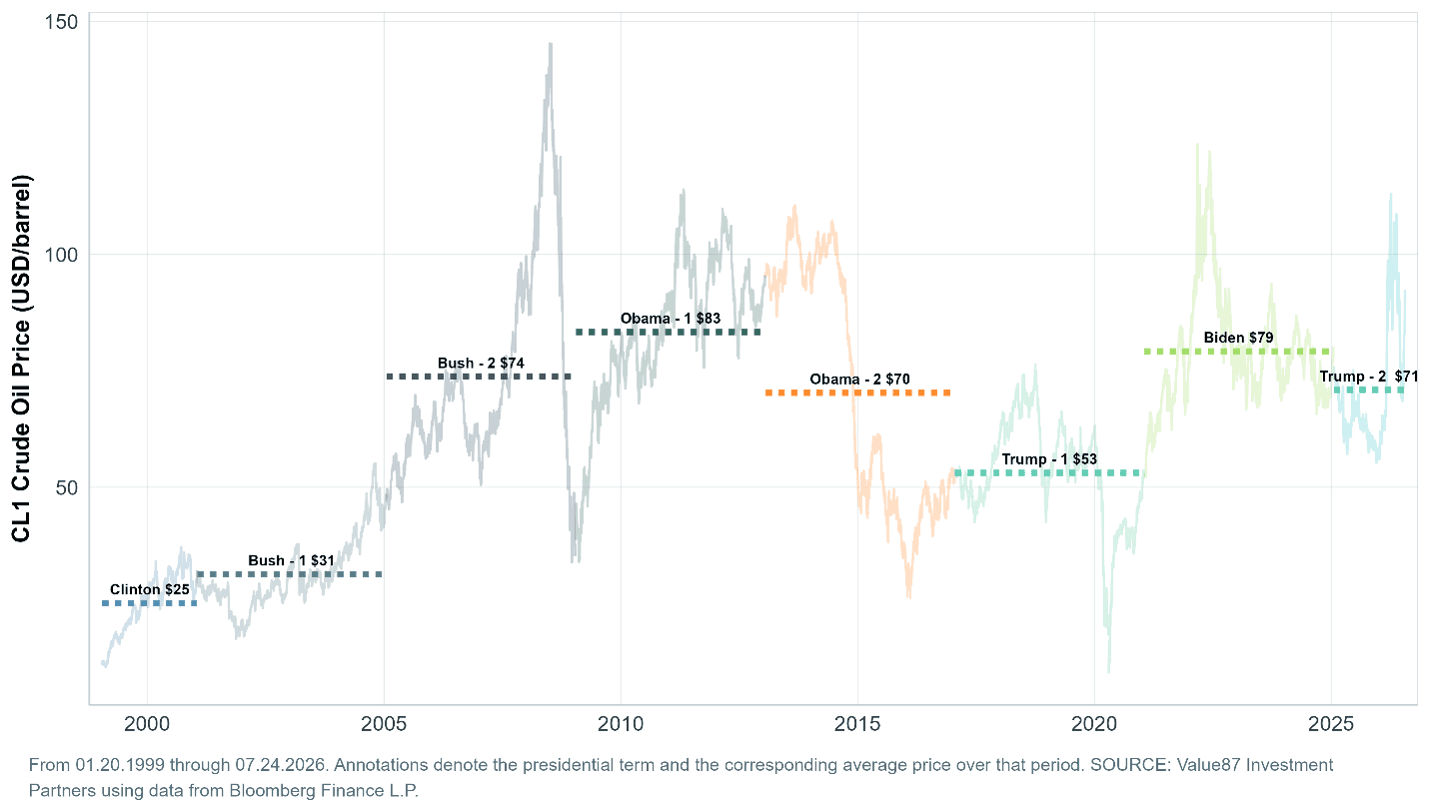
Obviously, sky-high oil prices are reason for consternation, and the current price is well above the Trump 47 average, but it is interesting to look at the average price for a barrel of crude under the last 8 Presidential administrations,…
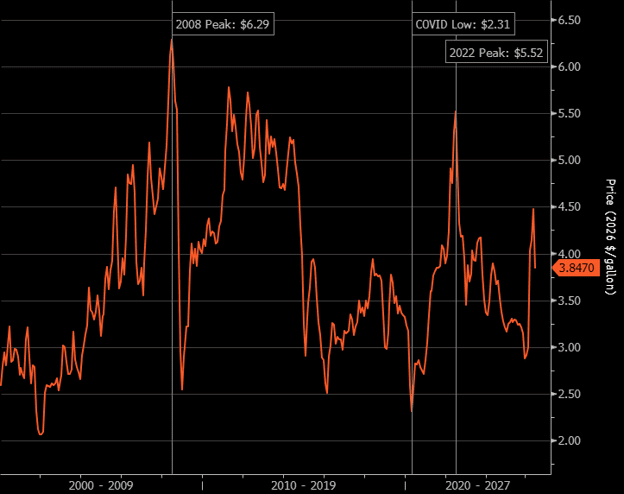
…while a look at inflation-adjusted prices at the pump created via the use of Bloomberg’s AI tool over the last quarter century puts the current hardship into a bit different perspective!
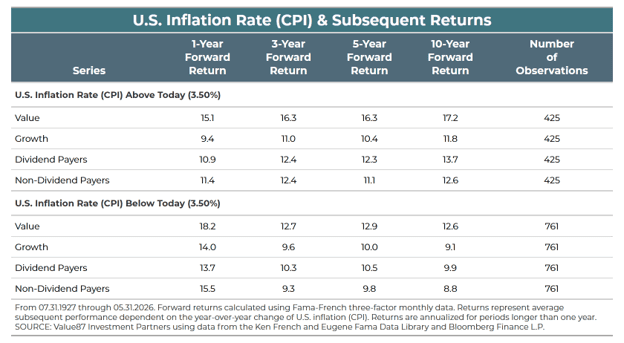
Certainly, higher energy prices don’t help the inflation numbers, but we think it important to look at what has happened to stocks, ON AVERAGE, when the actual Consumer Price Index is above and below the current 3.5% level,…
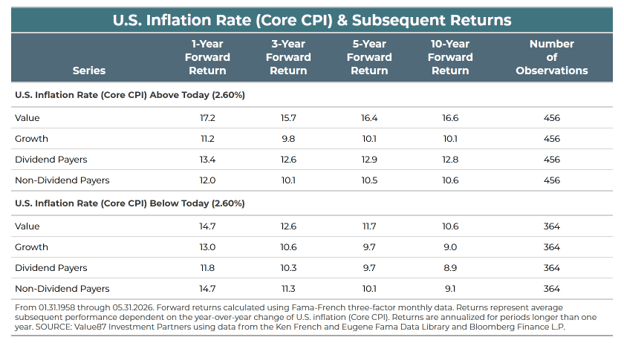
…and when the core CPI, which excludes volatile food and energy prices, is above and below the current 2.8% reading.
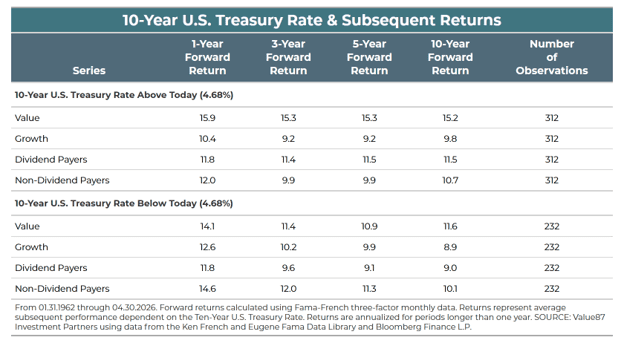
Yes, the textbooks would suggest that an elevated 10-Year U.S. Treasury rate shouldn’t be grand for equities either, but that is not what the figures dating back to 1962 suggest.
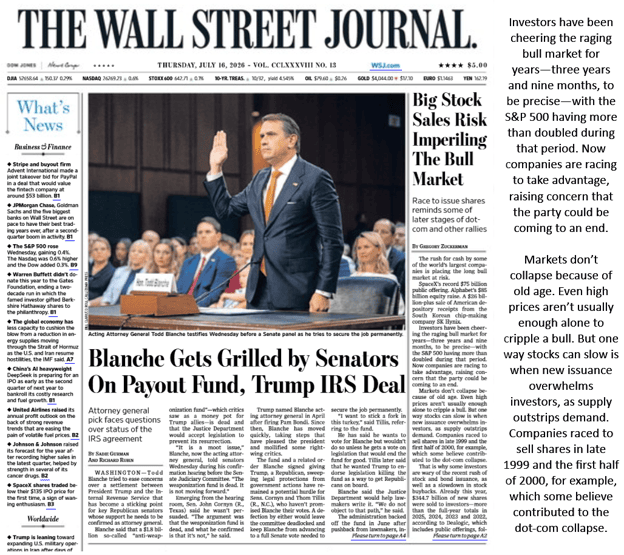
Needless to say, we learned long ago not to believe everything we read, so given that the July 16, 2026, edition of The Wall Street Journal featured an above-the-fold front page story that highlighted the age of the Bull Market, we thought this a fine time to offer our public service announcement on the subject.
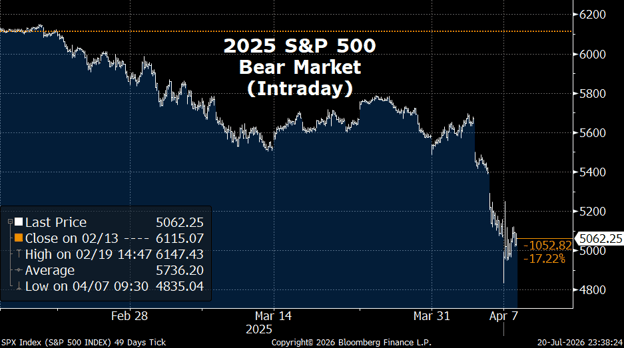
We respect that the “official” record of 20% declines counts only closing prices, but we remind investors that the markets trade while they are open, meaning that intraday drops that cross that magic figure could be considered a Bear Market. Such was the case in the aftermath of the Liberation Day Tarriff announcement in April 2025 when the S&P 500 traded as low as 4535 on April 7, down 21.3% from a high of 6147.43 on February 19.
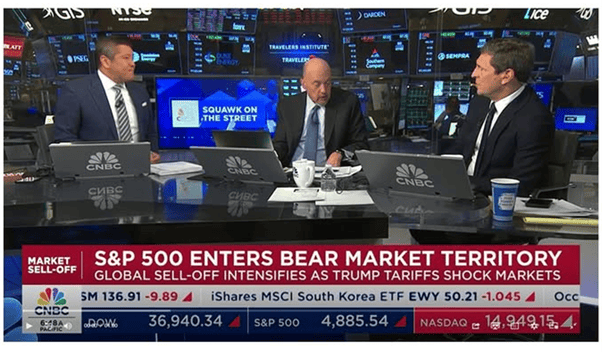
Yes, the index rallied on April 7 to escape the 20%-down threshold by a wide margin at the close, but none other than CNBC proclaimed that very morning that the S&P 500 had entered Bear Market Territory, while anyone with a trailing 20%-stop-loss order on the S&P would have seen their limit hit and their trade executed.
To be sure, the thrust of the WSJ piece was to highlight the recent flurry of stock issuance, drawing parallels to the Tech Bubble in late 1999 and early 2000, but we can’t forget that the Value indexes performed admirably in the ensuing years back then, while the Growth indexes cratered. In fact, from March 31, 2000 - March 31, 2005, the S&P 500 Pure Value index returned 103% the full five years, while its Growth counterpart lost 26.2% and the S&P 500 itself skidded 14.8%.
Indeed, it is always a market of stocks, and not simply a stock market, so we were also flummoxed by this past Thursday’s New York Times feature entitled, “A.I. Hopes Prop Up Both Stocks And Economy,” as the piece cited a supposed expert who said, “The thing that has been holding everything up is the A.I. story.”
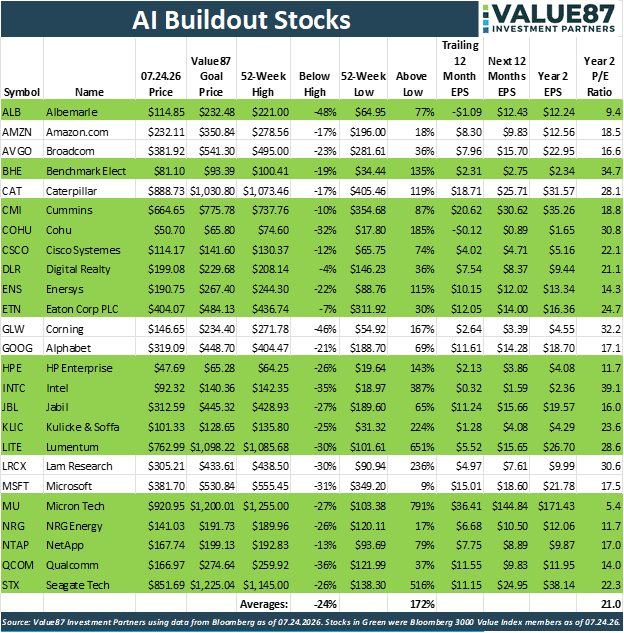
We don’t disagree that AI has been a major contributor to equity market returns this year, but the fact that the average AI Buildout Stock in the table below is off 24% from its high (i.e. in a Bear Market), shows us that the idea that AI is holding everything up is easily debunked by data.
Believe it or not, the average stock in the Bloomberg 3000 index is up 13.3% this year, while the cap-weighted and AI-dominated index itself is up just 9.4%. And last week, the S&P 500 Equal Weight Index inched up 0.08%, while the S&P 500 itself lost 0.60%, and the returns race since Halloween is decidedly in favor of the former by a score of 15.2% to 9.3%. This has been a broad-based advance and not one solely driven by AI.
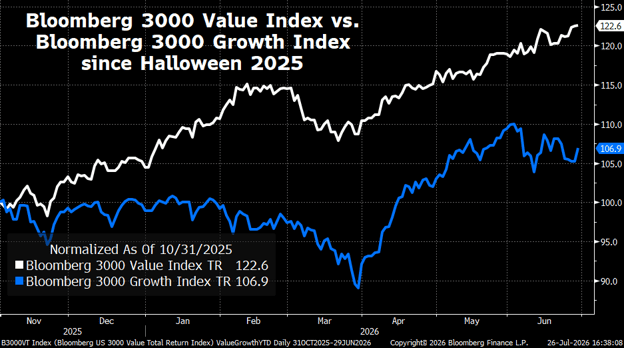
Further, since many an AI name is on the Growth side of the spectrum in the Bloomberg 3000 index, we conclude by noting that the Bloomberg 3000 Value index has outperformed the Bloomberg 3000 Growth index by 15.7 percentage points (or 1,570 basis points) since Halloween 2025!
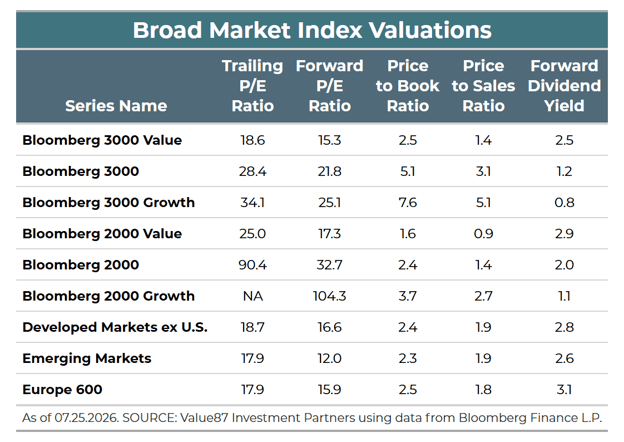
Time will tell whether Value continues to outperform, but we remain fond of the relative valuation metrics on the Value indexes,…
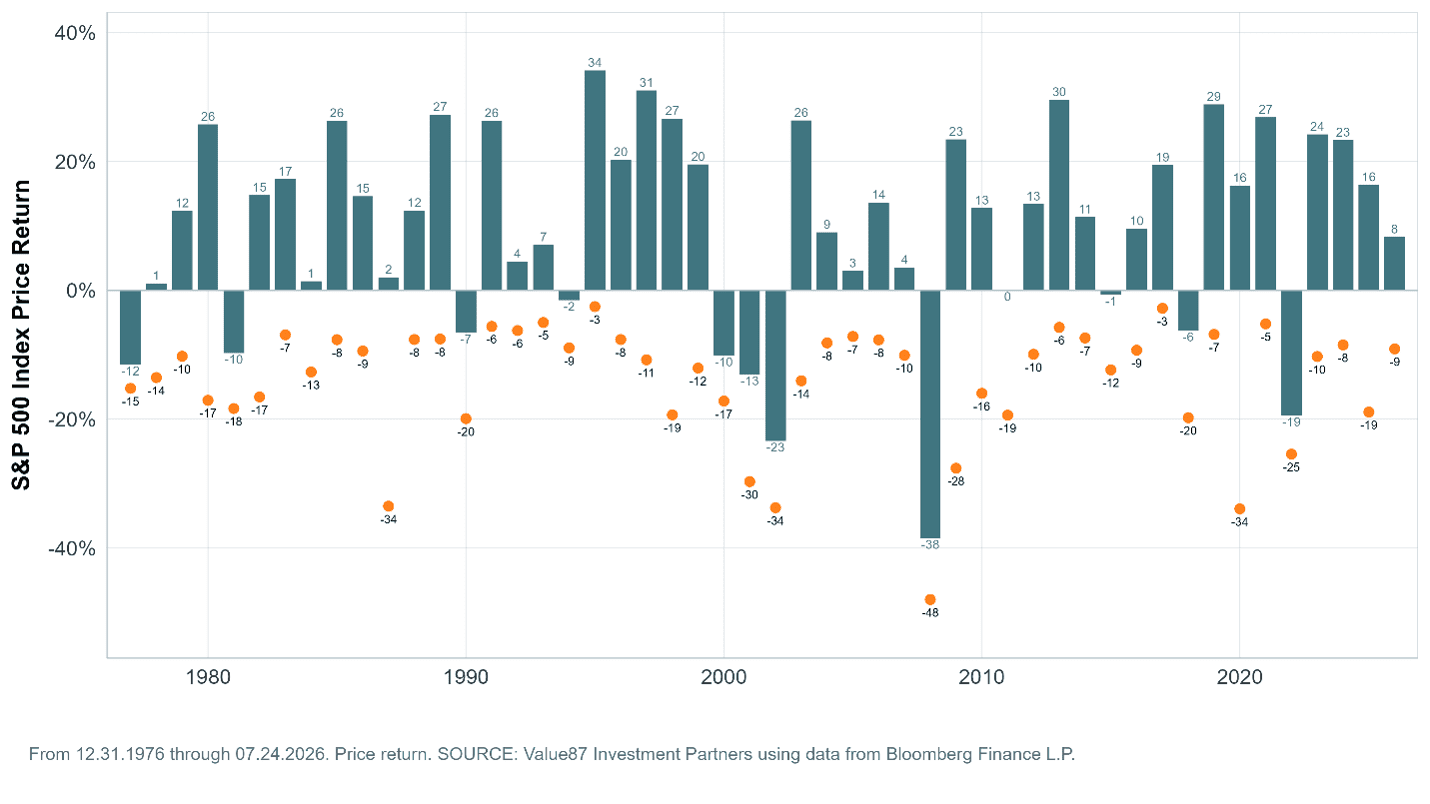
…even as we are always braced for market volatility.
The newspaper articles mentioned above were written before the latest Trump salvos on the tariff front, so we end our reason-and-evaluation discussion with the reminder that levies always have been part of the political landscape,…
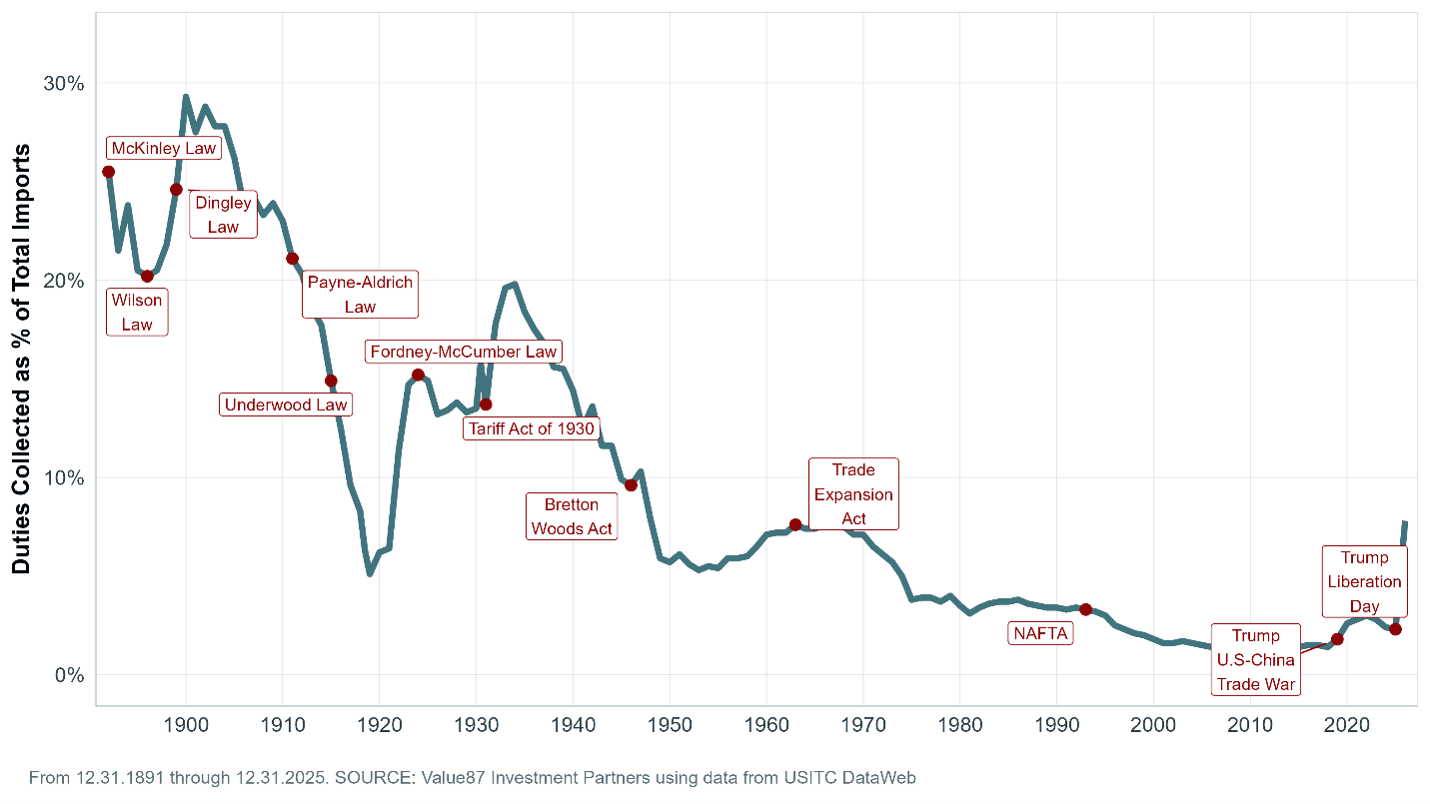
…including under the current occupant of the Oval Office.
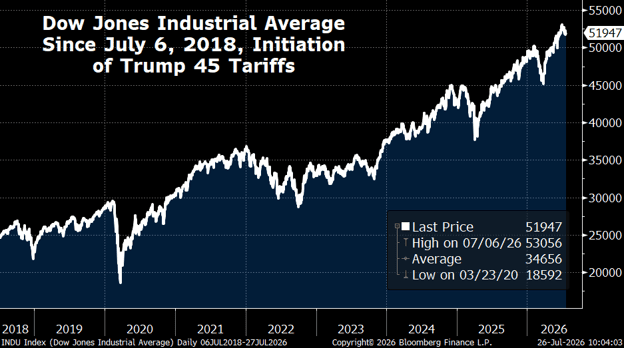
Of course, despite decades of historical data stating no obvious correlation, we know that should there be a sizable trip south for stocks in the near term, the conflict in the Middle East, high oil prices, high inflation, high interest rates, Bull Market age, AI and/or tariffs will get the blame!