
With the week and the month ending on a positive note, the Wall Street adage “Sell in May and Go Away” would have proved costly this time around, especially as the historical evidence merely suggests that the May – October six-month period is seasonally less favorable…but still positive…than the November – April time span.
Certainly, stocks could have moved south, as data from Professors Eugne F. Fama and Kenneth R. French show that there is red ink spilled on a monthly basis a bit more than a third of the time, but there was little reason for complaint in May. True, we note that the Russell 3000 Growth index outperformed the Russell 3000 Value index (R3KV) by a score of 7.2% to 2.9%, but the latter holds a more than 1100 basis-point-lead since Halloween. Further, it isn’t as if some R3KV members (stocks in green in the table below) have not participated in the ongoing rampage in the AI trade.
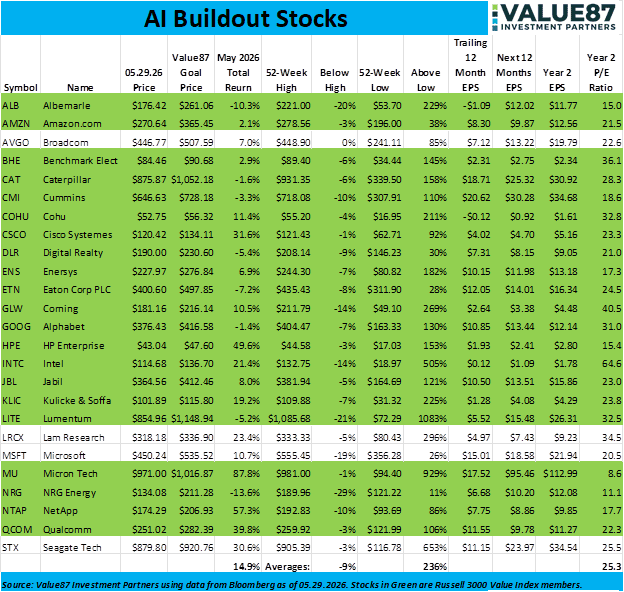
Of course, the rising tide did not lift all boats last month, as evidenced by the bottom 25 performers amongst our Flagship Value and Yield strategy holdings, with Russell 3000 Value members again highlighted in green.

Happily, the winners won more than the losers lost last month, which is why we always advocate holding a broad portfolio of reasonably priced stocks, no matter what might be dominating the newspaper headlines, although diversification and valuation discipline do not guarantee positive investment results or protection from loss.
After all, it isn’t as if events last week on the economic front were cause for cheer, given that the core PCE Price Index, rose 3.3% in April on an annual basis, the largest increase in the Federal Reserve’s preferred measure of inflation since November 2023, first quarter U.S. GDP growth on an inflation-adjusted basis was revised down to 1.6% from the initial 2.0% estimate, and housing data was weaker than expected, be it numbers on building permits, mortgage applications or new home sales.
However, given that many of the major market averages were trading at all-time highs as June began, just about any way prior evidence is evaluated supports our long-held belief that, based on historical market data, time in the market trumps market timing. Interestingly, given that Crane Data LLC just reported that there is $8.281 trillion invested in money market funds, a new all-time high, while there remain more Bears than Bulls in the latest weekly AAII Sentiment Survey, more than a few folks have been sitting out the rally.
Certainly, there is nothing wrong with keeping money needed in the near term or dollars that can’t be exposed to short-term losses invested in cash as stocks remain a volatile asset class, with sizable setbacks occurring every year, but the historical evidence shows that there are far more positive blue bars than negative orange bars in the S&P 500 annual returns table presented below.

And the trend over the years in the equity indexes, like the R3KV, has been higher, so we retain our enthusiasm for the long-term prospects of the stocks we own, even as we offer the usual caveat that 5% drops in the indexes take place 3 times per year on average, 10% corrections occur every 11 months or so and 20% Bear Markets happen every 3+ years, on average.