
It has only been a week and Jeff Sommer, the usually pessimistic New York Times Sunday Columnist took Labor Day Weekend off, so we won’t know if his August 30th optimistic piece, entitled “What if This Market Rally Is Just Getting Started,” was a one-time deviation from his typical fare, lest we think we should be fearful when others are greedy…or less Bearish.
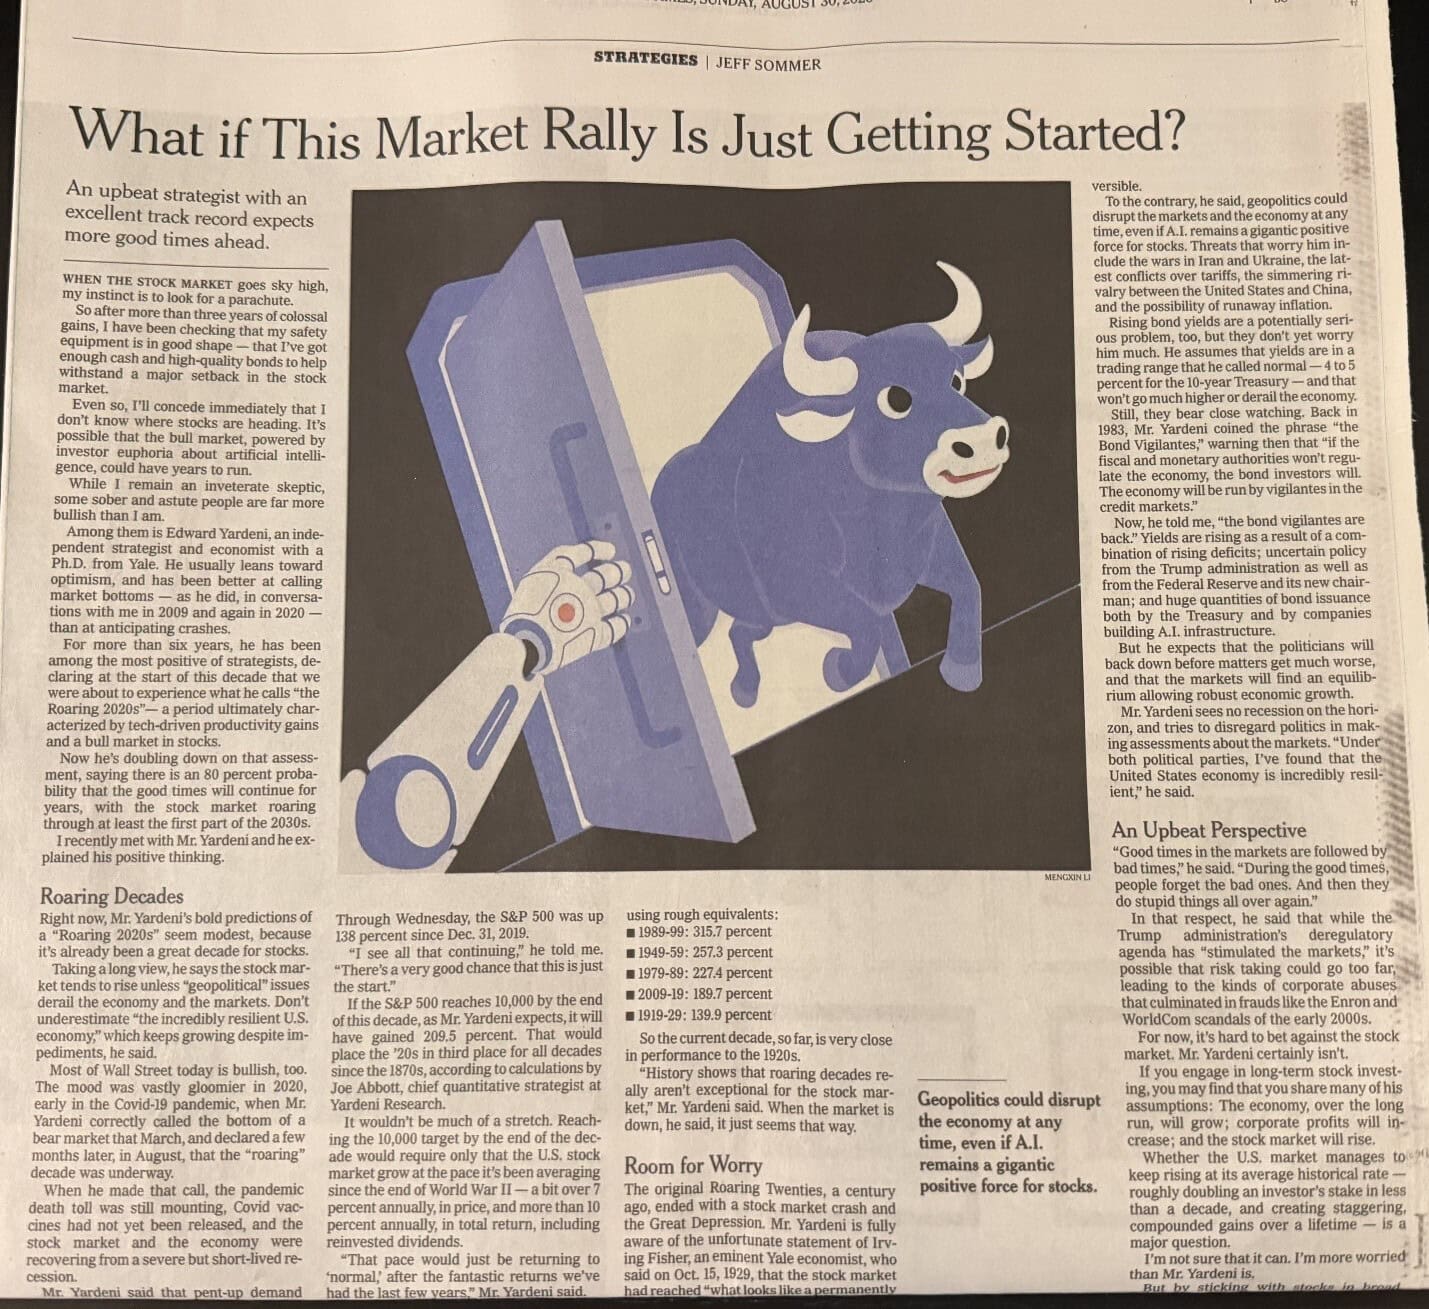
At least Mr. Sommer cautioned that the Bullish strategist whose research he cited has been better at calling market bottoms and he said he is more worried than is Mr. Yardeni, while his editors cautioned in the callout, “Geopolitics could disrupt the economy at any time,” so we suspect he will be back to negativity in his next column.
After all, constantly reminding folks that time in the market trumps marking timing isn’t likely to attract as many eyeballs, even as the long-term trend in stock prices has been higher,...
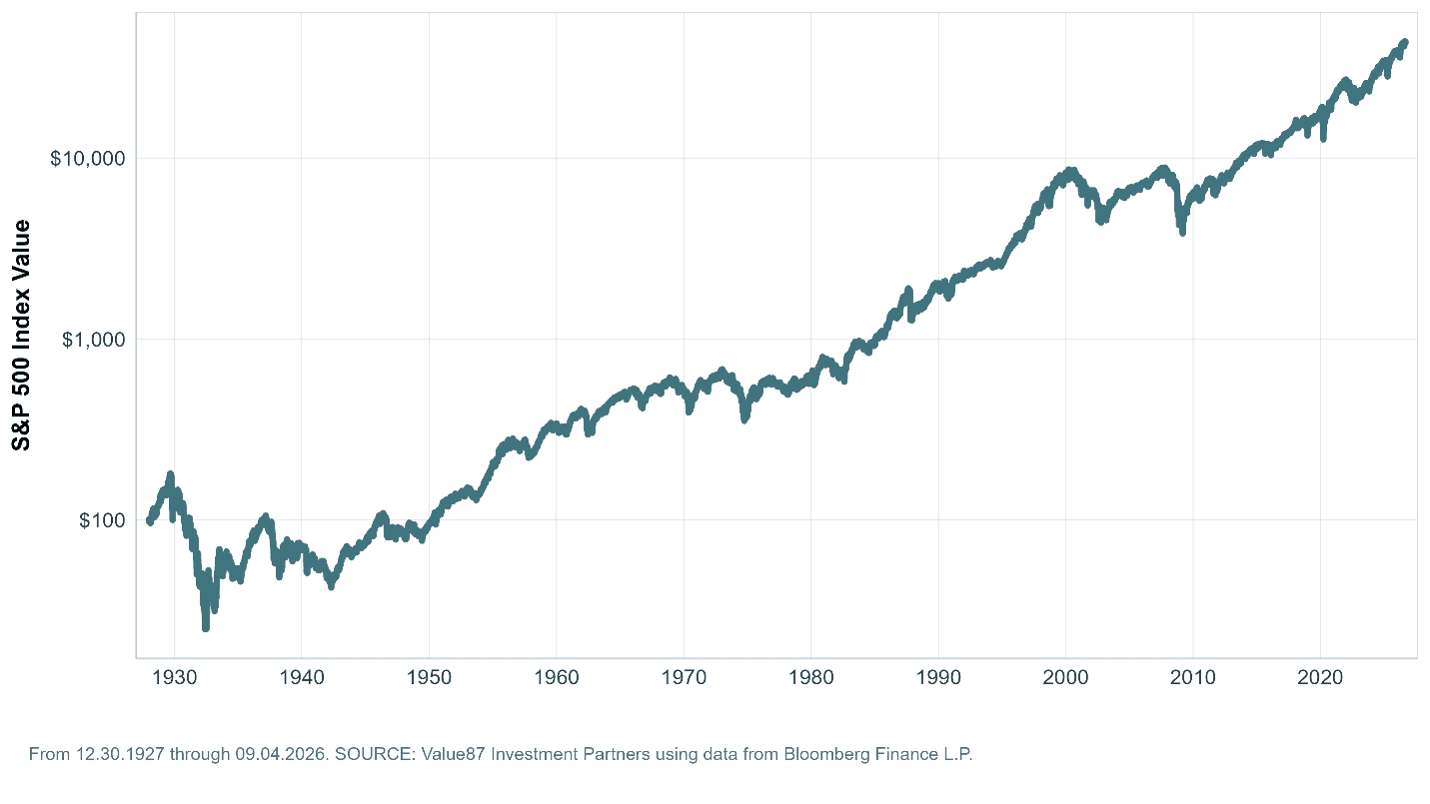
…albeit with intervening trips to the downside (the orange dots in the chart below) each and every year.
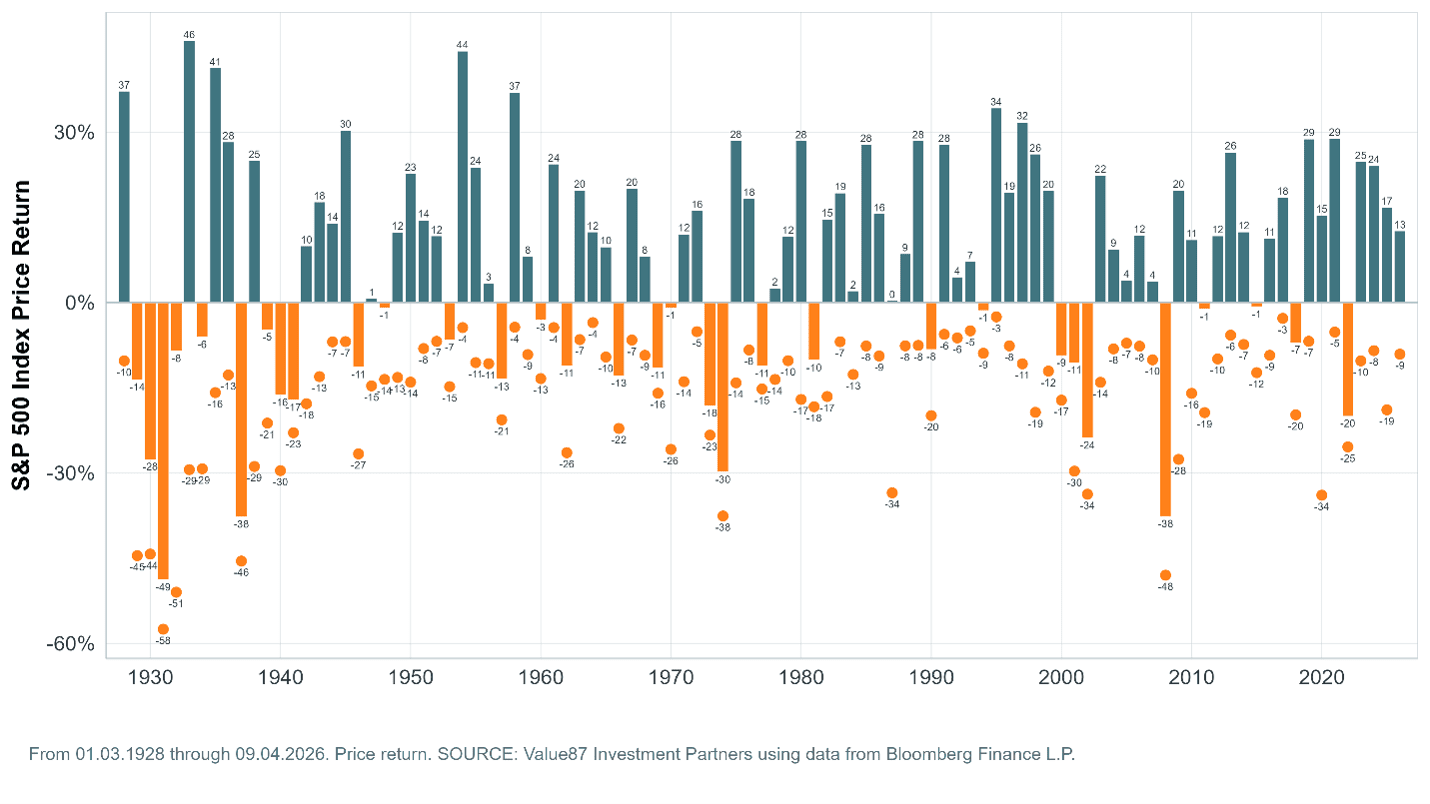
No doubt it would be nice to avoid the selloffs and somehow only be positioned for the rallies, but they each happen with surprising frequency,…
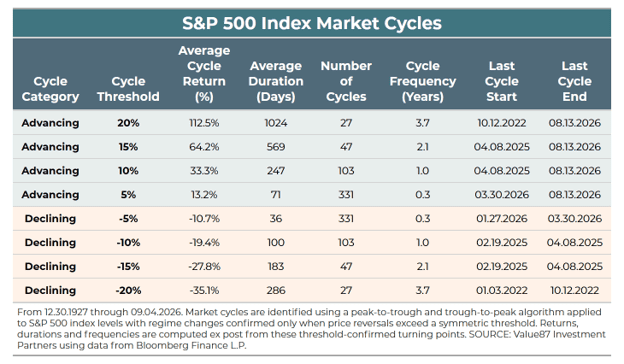
…and returns that have been generated over the past century in stocks simply by staying the course have been very good,…
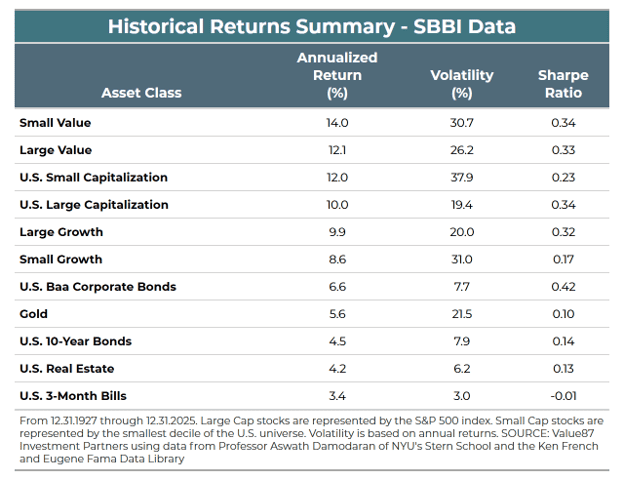
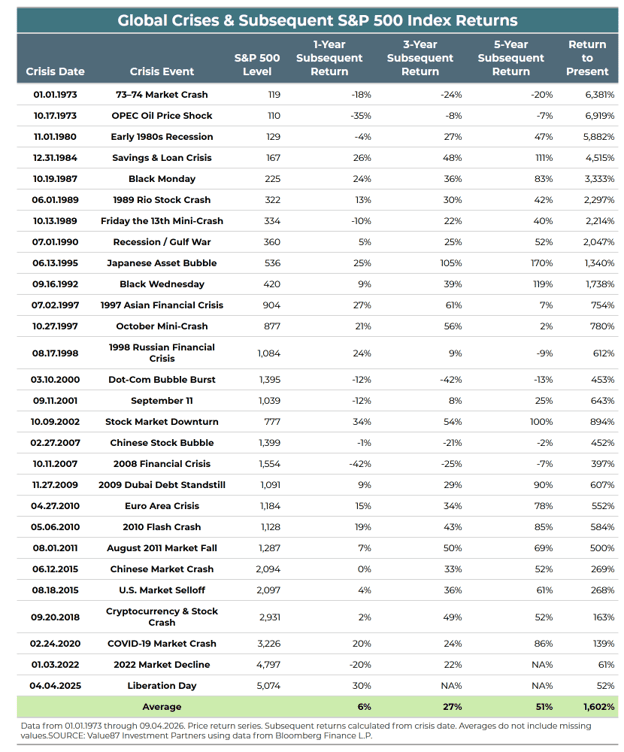
…so much so that we are convinced that the secret to success in stocks is not to get scared out of them, especially given all of the disconcerting headlines through the years that have been overcome in the fullness of time.
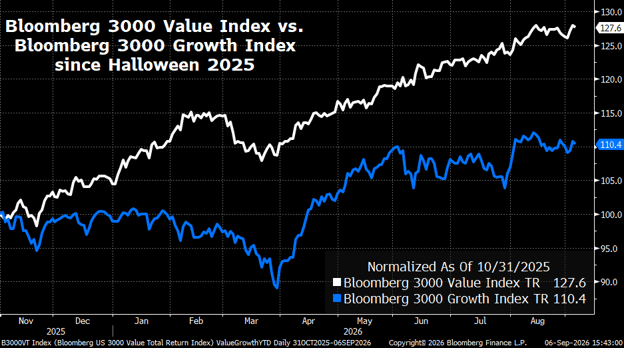
None of this means that the solid start to September will continue, which saw the Bloomberg 3000 Value index widen its performance advantage since Halloween over its Growth counterpart last week,…
…and we concede that we are now in the worst performing month of the year historically for stocks,…
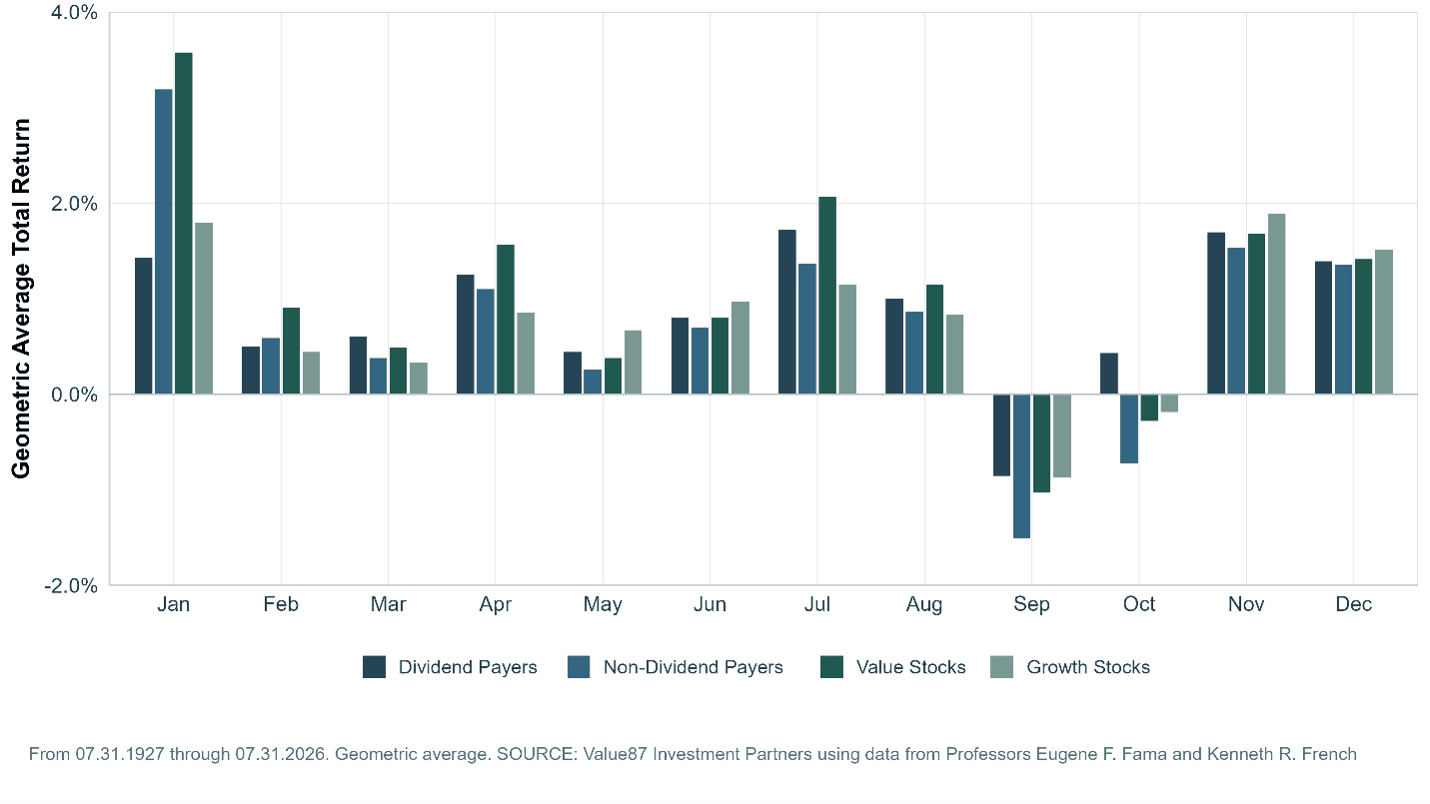
…with the two-month September-October timespan the spookiest period.
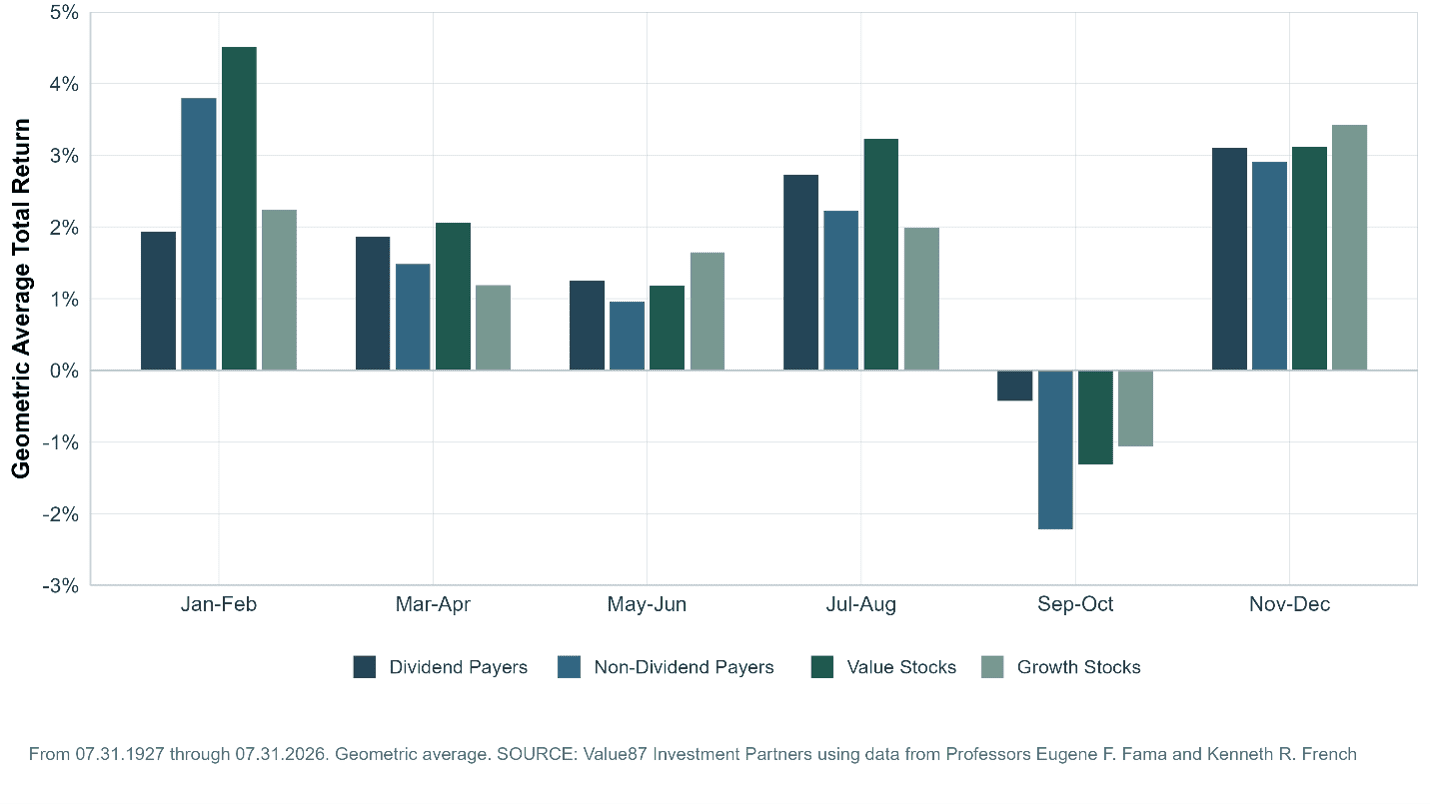
As such, we always remain braced for volatility and our portfolios these days have a little extra dry powder available for future opportunities, but we see no reason to alter our enthusiasm for the long-term prospects of equities in general and Value stocks in particular, especially as we think the latter are still reasonbly priced,…
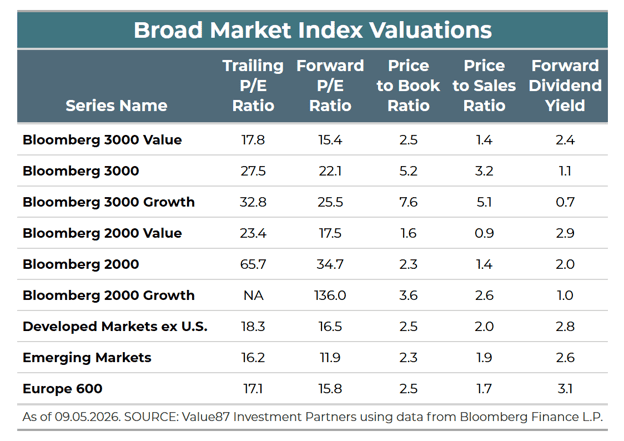
…and the outlook for corporate profit growth is robust,…
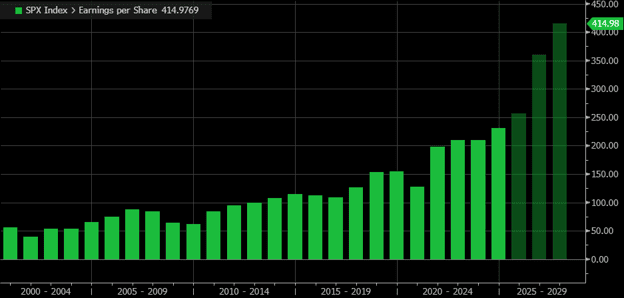
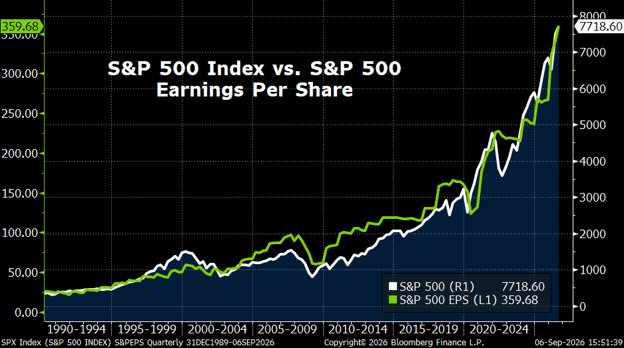
…with stock prices, on average, historically following earnings higher over time.
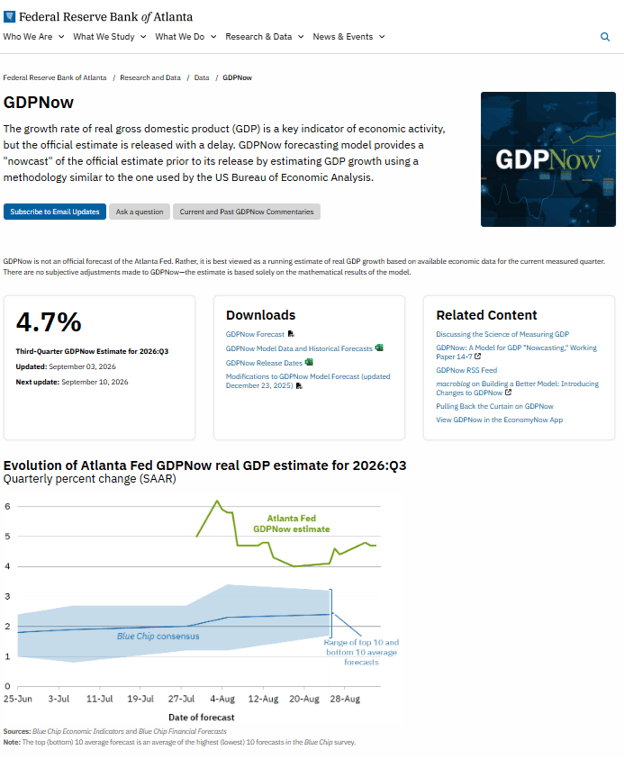
We understand that earnings are driven by economic growth and the health of the U.S. economy is never assured, as is always the case, but the latest estimate for Q3 real (inflation-adjusted) GDP growth is a generous 4.7%, with that projection from the Atlanta Fed made prior to Friday’s announcement of a much-better-than-expected increase in nonfarm payrolls of 162,000 in August and a steady unemployment rate of 4.1%.
Of course, even as wage pressures in August were well contained, the strong employment report boosted the likelihood that the Federal Reserve will hike its target for the Federal Funds rates,…
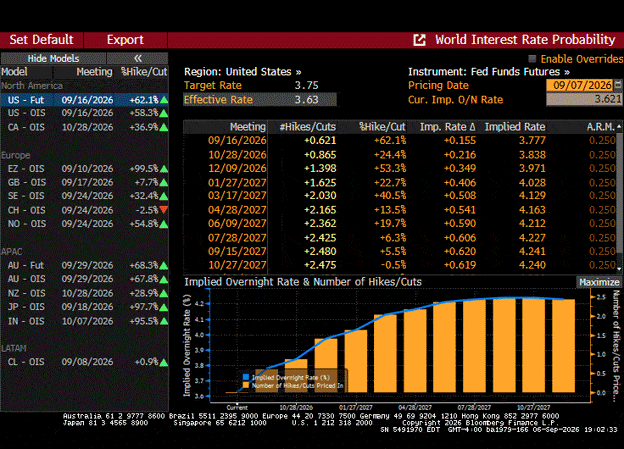
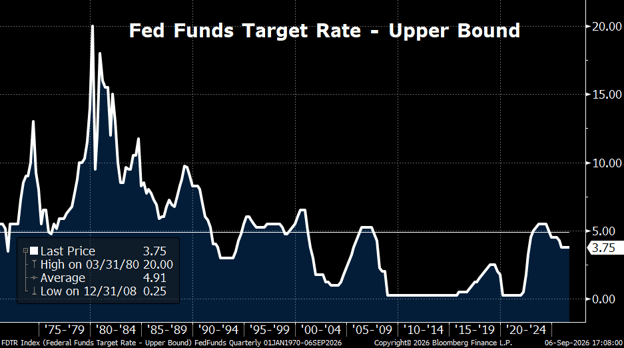
…which would still be on the low end of the historical spectrum.
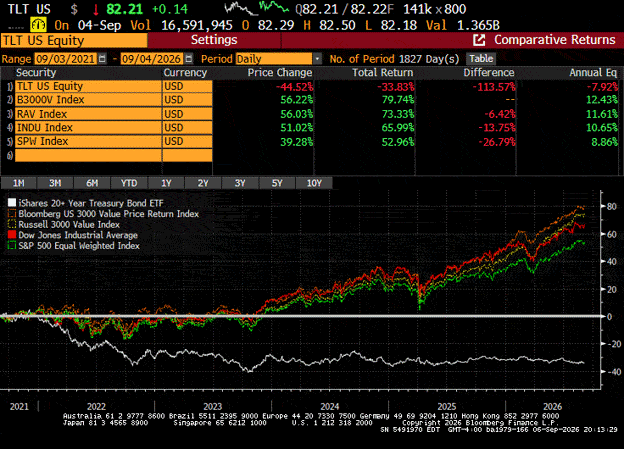
What’s more, despite recent arguments in a prominent financial publication to the contrary, rising interest rates historically have not been a reason to abandon equities, especially considering that the 30-Year U.S. Treasury Yield has risen from less than 2% five years ago to more than 5% today,…
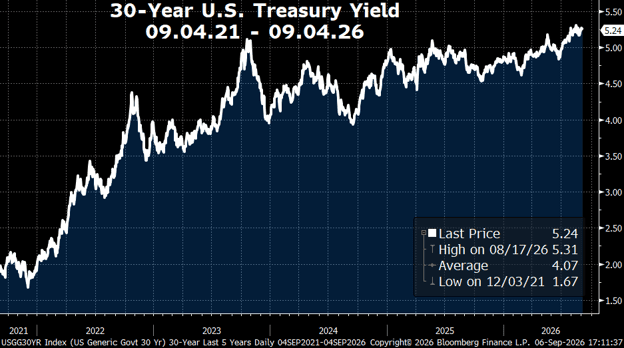
…resulting in massive losses for holders of a long-term Treasury ETF (ticker symbol TLT), while there were big gains for equity prices.
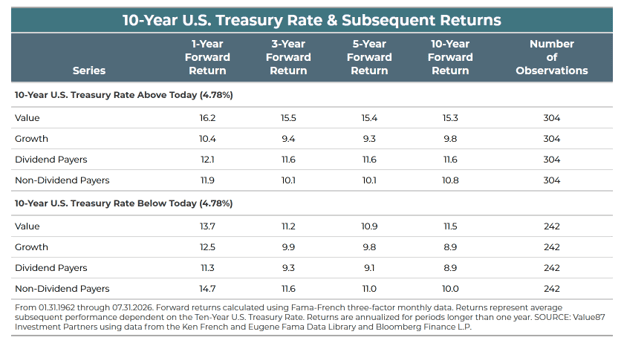
As we wrote last week, anything can happen and, all else equal, higher interest rates should make other investments less appealing, but all else is never equal. Further, the historical data shows little correlation between Treasury yields and equity returns,...
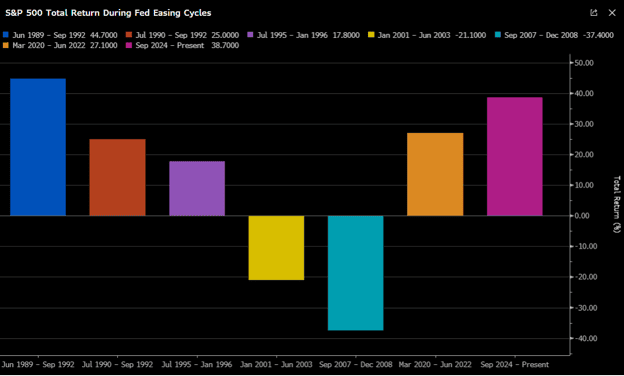
…while Bloomberg AI built charts for us showing the S&P 500’s return during the prior 6 monetary policy easing cycles,...
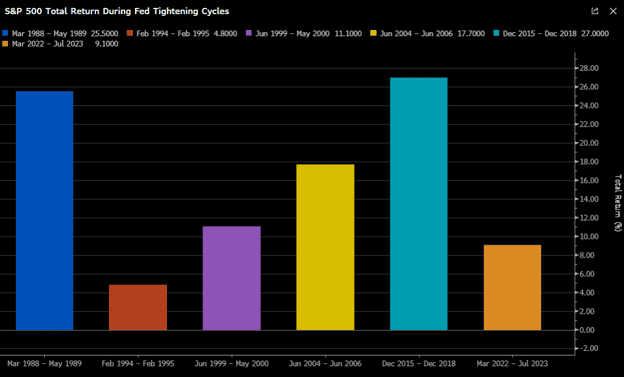
…and the returns of that index during the previous 6 tightening cycles, with little that can be gleaned in our view about equities when and if these events occur in the future.
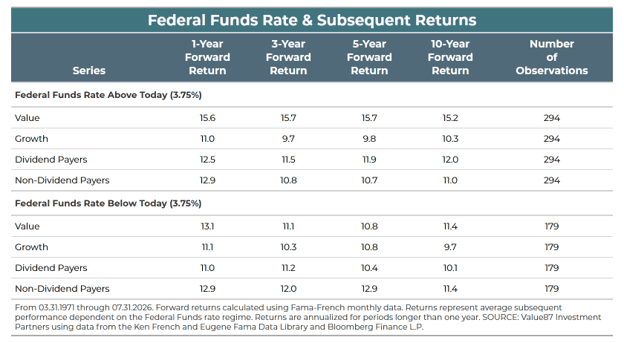
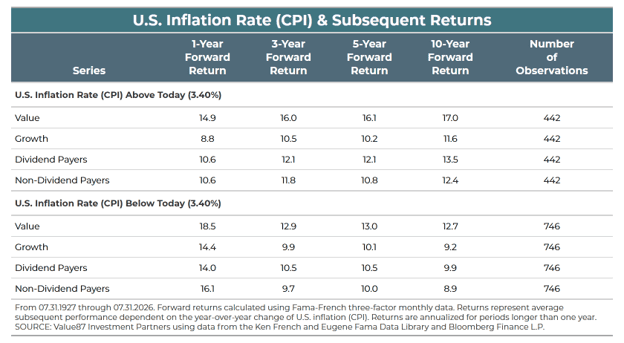
Despite all the consternation around what the Fed will do with rates, the long-term analytics also do not show much difference in returns when considering whether the U.S. central bank’s lending rate is higher or lower than today’s 3.75% upper bound,…
…or whether U.S. inflation is above or below the current 3.4% increase in the Consumer Price Index.
And for those worried about the U.S. national debt hitting the $40 trillion mark, here is how the Dow Jones Industrial Average has fared since the red ink first hit $1 trillion during the Reagan Administration on October 22, 1981.
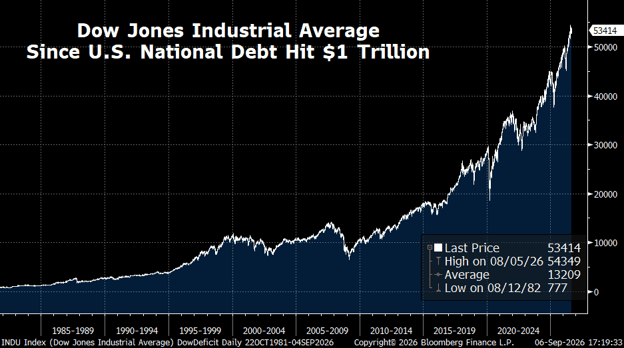
We are not suggesting that the debt doesn’t matter nor that it isn’t something that could one day prove to be an equity-market headwind, but the Dow has enjoyed an 11.26% annualized rate of return over the past 45 years, so sitting on the sidelines because Uncle Sam couldn’t balance his checkbook would have been a costly decision.
There will always be something about which to worry, and the media will be quick to point to the disaster du jour should stocks endure a downturn, but we offer the reminder that two of the potential “I-told-you-so” issues today have long been something with which investors have had to contend.
Indeed, U.S. military involvement in the Middle East has been going on for 36 years,…
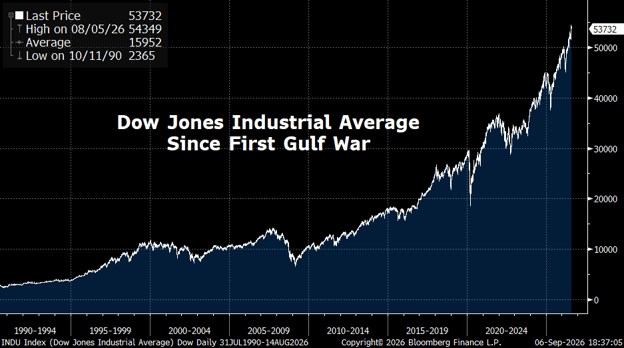
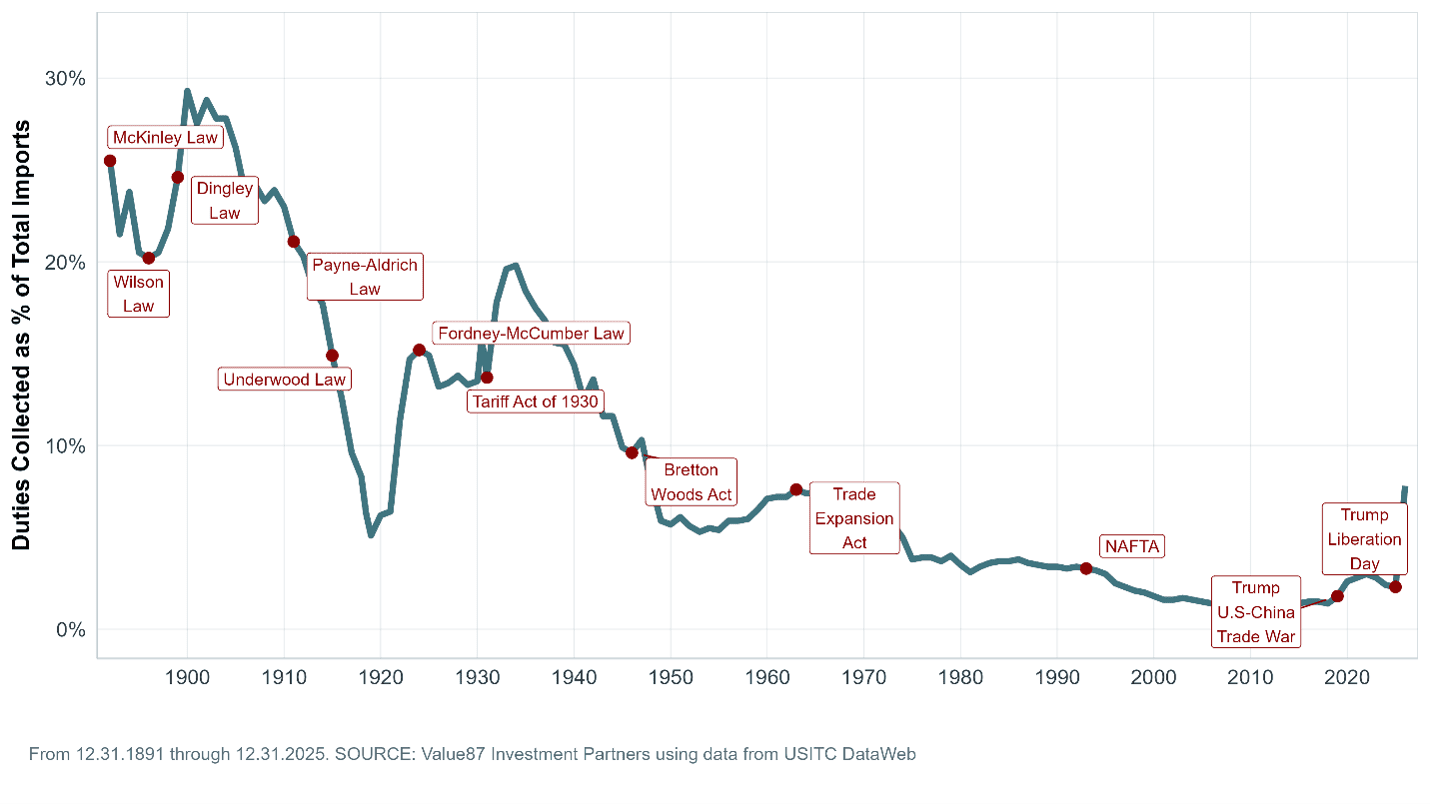
…and tariffs have been part of the investment landscape for more than a century.
Stocks in the News
Chris Quigley and Jason Clark provide pertinent updates…